Published September 24, 2026 · measurements September 23–24 · public release 1.0
Back to Aero · Evidence index · Download measured aggregates
The short answer
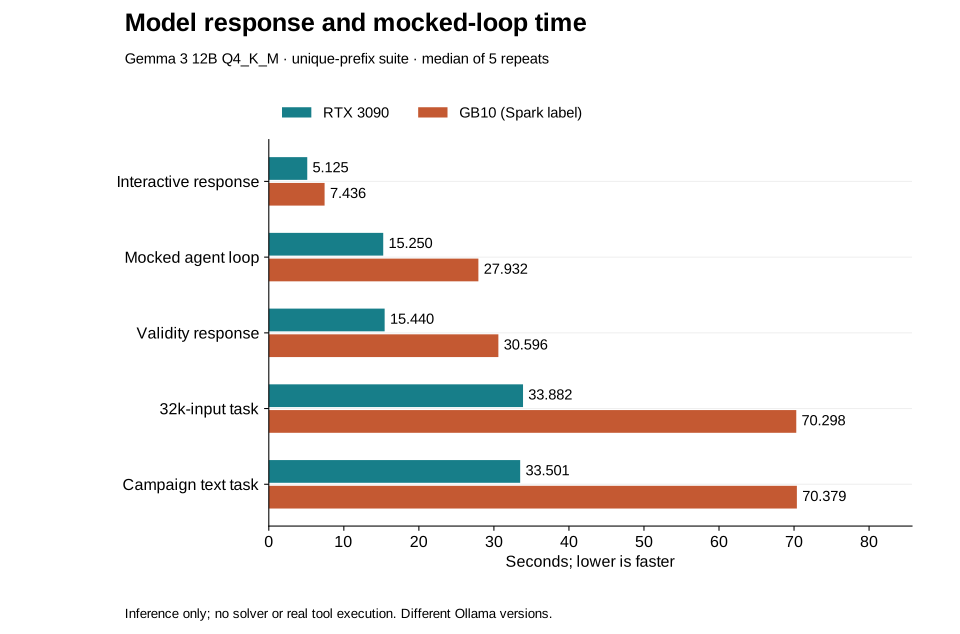
The RTX 3090 workstation completed the tested same-model inference tasks faster. The GB10 system completed a larger context ladder, reaching 128k with five measured repetitions. Neither result establishes which machine finishes a real engineering investigation faster.
This is an inference benchmark with synthetic engineering prompts and mocked agent tools, not a CFD/FEA benchmark, a solver-accuracy comparison, or a hardware purchasing recommendation. The GB10 node is called “Spark” in the retained benchmark labels; it is the local GX10/GB10 system, not a separately tested second DGX Spark product.
Same model, different endpoints
The headline comparison uses the same Gemma 3 12B Q4_K_M model digest, matching prompts and settings, one warm-up and five measured repetitions per completed configuration. Medians are the primary statistic. A deterministic unique prefix changes between repetitions and is identical between systems for each repetition, reducing repeated-prefix cache reuse.
| Synthetic workload | RTX 3090 median | GB10 median | GB10 / 3090 time |
|---|---|---|---|
| Short interactive engineering response | 5.12 s | 7.44 s | 1.45× |
| Large engineering context, approximately 32k input | 33.88 s | 70.30 s | 2.07× |
| Four-call mocked agent loop | 15.25 s | 27.93 s | 1.83× |
| Engineering-validity response | 15.44 s | 30.60 s | 1.98× |
| Synthetic overnight-campaign analysis | 33.50 s | 70.38 s | 2.10× |
“Overnight” describes the supplied campaign history, not an overnight simulation execution. A completed response is not automatically a correct or accepted engineering decision. Generated token counts can differ and are retained in the downloads.
Charts can be scrolled horizontally on small screens. Download any SVG for full-size inspection.
Time to first token matters too
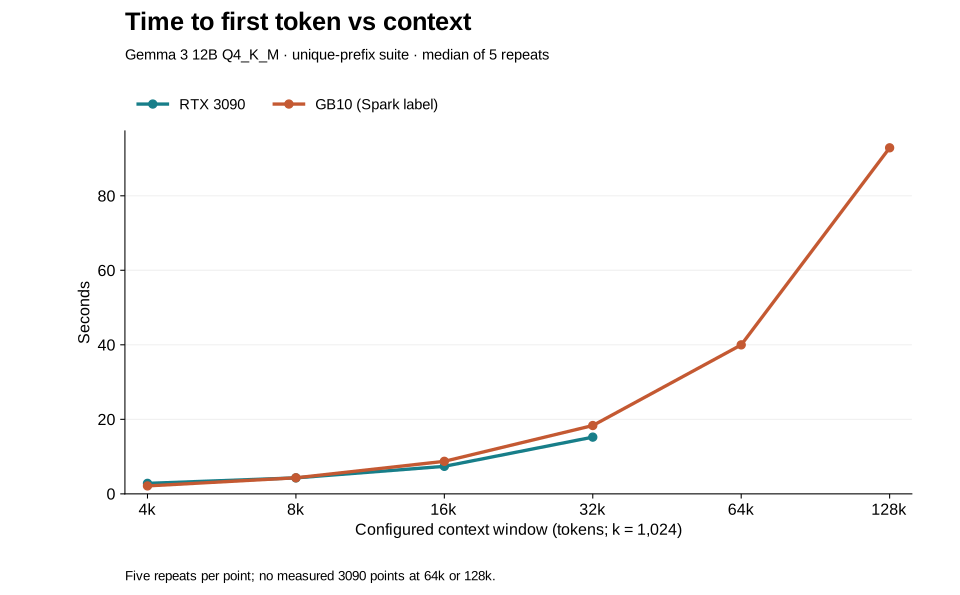
GB10 was not slower on every metric. On the short interactive task its median TTFT was 2.37 s, versus 3.06 s on the workstation. On the large-context task, TTFT was 18.75 s versus 15.63 s. That is why decode tokens per second alone is not a sufficient user-experience metric.
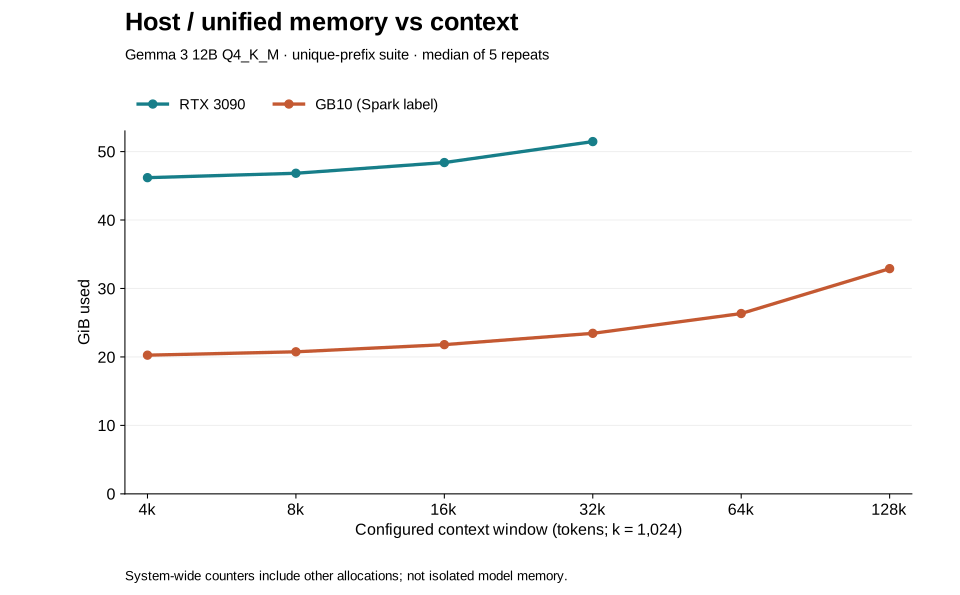
Context capacity: report the stop, not an invented OOM
The context ladder uses short outputs, approximately 70 tokens. It is distinct from the large-context task with an approximately 1,000-token output cap. Configured context includes space for the response; actual prompt counts are in the data.
| Configured context | RTX 3090 median wall time | GB10 median wall time | Measured repetitions, 3090 / GB10 |
|---|---|---|---|
| 4k | 3.89 s | 5.30 s | 5 / 5 |
| 8k | 5.41 s | 7.62 s | 5 / 5 |
| 16k | 8.57 s | 12.22 s | 5 / 5 |
| 32k | 16.49 s | 22.14 s | 5 / 5 |
| 64k | Not measured; one warm-up completed | 44.45 s | 0 / 5 |
| 128k | Not attempted | 98.65 s | 0 / 5 |
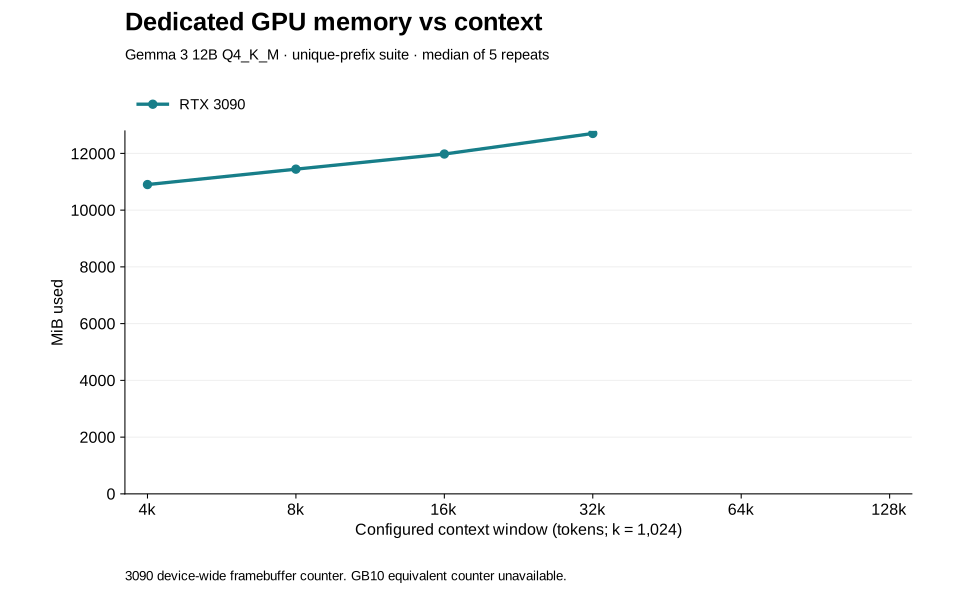
The 3090’s 64k warm-up succeeded. The predeclared 10,000 MiB free-VRAM reserve then stopped measured repeats at approximately 9,547 MiB free. This was a preventive safety stop, not an out-of-memory failure and not proof that a 3090 cannot run 64k. Background allocations and the conservative reserve limit the capacity conclusion.
What ran, and what was held constant
| Configuration | RTX 3090 workstation | GB10 node |
|---|---|---|
| OS / architecture | Windows 11, x86-64 | Ubuntu 24.04, ARM64 |
| Memory | 24 GiB dedicated VRAM; approximately 64 GiB system RAM | Approximately 121 GiB reported unified RAM |
| NVIDIA driver | 591.86 | 580.142 |
| Reported CUDA compatibility | 13.1 | 13.0 |
| Ollama runtime | 0.32.5 | 0.20.4 |
| Headline model | Gemma 3 12B Q4_K_M | Same model digest and quantization |
Sampling used temperature 0, top-p 1, top-k 40 and seed 42. Effective server contexts for interactive, agent-loop, validity and large-context tasks were 8,192, 8,192, 20,480 and 36,864 tokens respectively. Matching cells used matching output caps. The harness retained actual token counts, failures and stops. No benchmark model downloads, runtime installations or cloud inference were performed.
Runtime versions differ. This is an endpoint/service comparison, not an isolated GPU-silicon or memory-bandwidth experiment. Runs were sequential, not a randomized controlled simultaneous workload. Background activity was not fully isolated.
A cache effect changed the initial interpretation
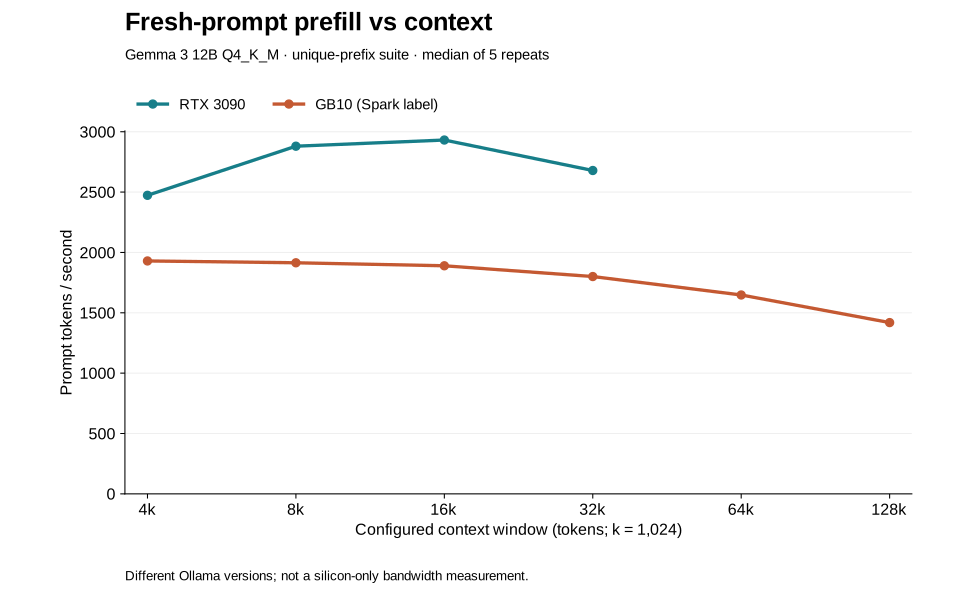
The first suite reused identical prompts. The workstation then reported around 94,000 prefill tokens/s on a repeated 32k prefix—a strong cache-reuse signature, not fresh-prompt throughput. Those results are preserved, not silently discarded.
The unique-prefix extension produced approximately 2,679 versus 1,800 prefill tokens/s at the 32k context rung. The large-context response took 33.9 versus 70.3 seconds, roughly 2.1× rather than the initial warm-cache impression of roughly 3.5×. The extension reduces that confound; it does not prove that every runtime cache mechanism is absent.
The published headline charts use the unique-prefix extension. Original warmed-prefix aggregates remain downloadable and separately labeled.
Different models: useful, but not hardware-fair
Installed practical models were also tested. These are selected tested options, not proof of the best model either machine can run.
| System / model | Mocked agent loop median | Engineering-validity response median |
|---|---|---|
| RTX 3090 / Qwen2.5-Coder 14B Q4 | 12.78 s | 10.20 s |
| GB10 / Qwen3-Coder 30B-A3B Q4 | 15.03 s | 21.54 s |
These figures come from the original repeated-prefix suite. They must not be compared as controlled fresh-prompt hardware measurements. A small deterministic expected-fact rubric and retained answers support later review; the rubric is not an independent engineering-quality assessment. No claim of “Opus-level” coding or a general quality winner is supported.
The GB10 executed one Qwen2.5 72B Q4 warm-up with full reported GPU residency: 508.07 s, 218.75 s TTFT, 3.47 generated tokens/s. Another resident model changed memory availability; the measured repetitions were stopped. This is a single capacity observation, not an n=5 performance result. The installed 120B model was not tested.
Decode speed and energy are supporting measurements
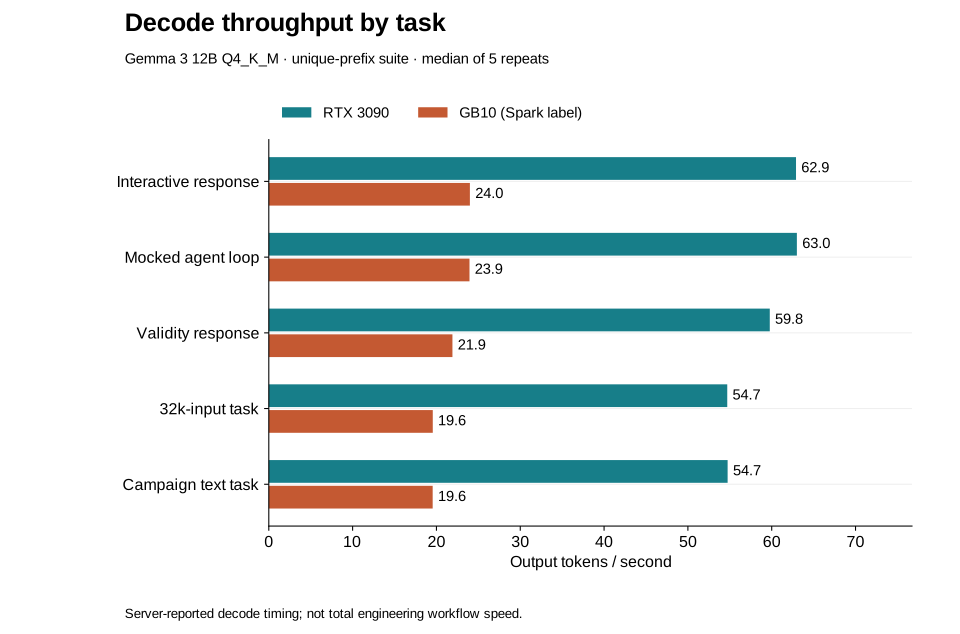
At 55 tokens/s, generating 500 tokens takes about 9.1 seconds and 1,000 tokens about 18.2 seconds, before prefill and tools. That rate was not reproduced on GB10 for the tested 12B large-context workload, which decoded around 20 tokens/s. Whether 55 tokens/s is “enough” depends on the full workload; actual retrieval, simulations and human review were not timed here.
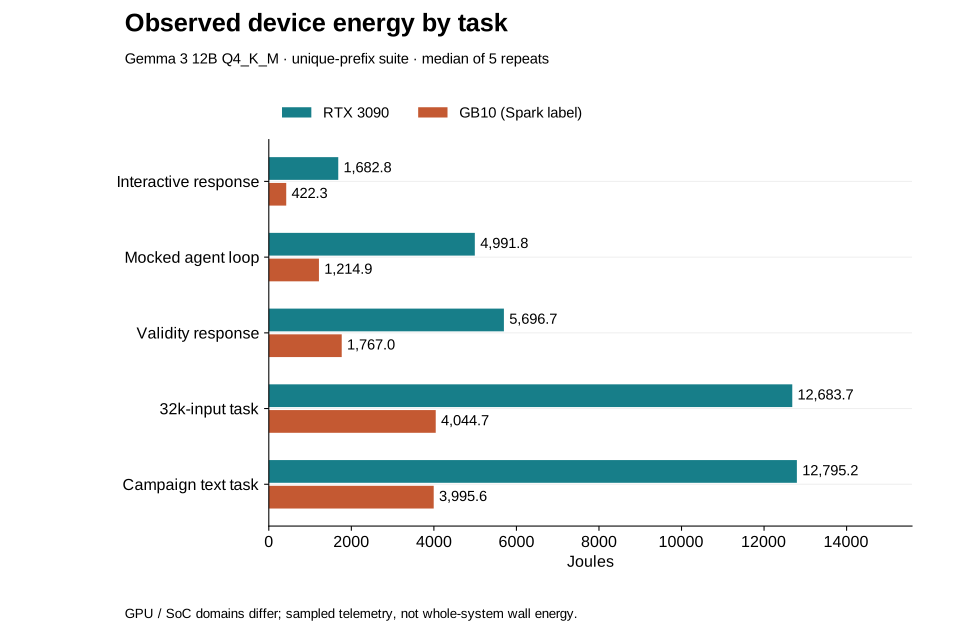
Energy estimates integrate available sampled NVIDIA device power. They are not wall-meter measurements; GPU and SoC domains differ, short samples can be weak, and background work can contribute. Missing telemetry is unavailable, not zero. Do not use this chart alone for electricity-cost comparisons.
What this benchmark does not establish
- No actual CFD/FEA solve, solver-result quality comparison or accepted end-to-end engineering decision was measured.
- No controlled simultaneous Spark-plus-GPU workload, two-Spark system, or newer high-memory workstation GPU was tested.
- Memory counters are system/device observations, not consistently isolated per-model allocations.
- The capacity sweep and independent quality assessment remain incomplete.
- Five repeats provide a useful local snapshot, not population-level certainty. The reported p95 is a small-sample descriptive statistic.
- No hardware upgrade or employer deployment is endorsed by this report.
Reusable public data
The export contains selected aggregate measurements only. Private hostnames, network addresses, credentials, local paths and the private Aero toolkit are excluded. Original source evidence remains retained privately; this public subset is not the complete raw reproducibility archive.
- Fresh-prefix results: CSV · JSON
- Original warmed-prefix results: CSV · JSON
- Export scope and methodology
- Public artifact SHA-256 manifest
The aggregates include sample counts, mean, median, minimum, maximum, standard deviation, descriptive p95, token counts and available telemetry. Blank or null values remain unavailable.
The next experiment
Measure seconds to an independently accepted engineering result on one fixed synthetic task, with the same engineering acceptance criteria: workstation-only; GB10 reasoning plus workstation engineering; and, if available, a real two-Spark configuration. Report errors, retries, human corrections, memory limits and the time split among inference, tools and simulation. A cloud model may be an additional reasoning-quality control, but cannot stand in for measurements of two Sparks.
For now, the evidence supports a measured inference latency/capacity tradeoff—not a winner for the complete Aero pipeline.